The evaporation or/and evapotranspiration are the one of the most difficult term to be measured accurately. Until now, we do not have perfect method to measure it. The eddy correlation method using high response anemometer, thermometer and hygrometer are thought to be most reliable technic, because it can be understood as a direct measurement of turbulence transport. But it still has some problems, such as the calibration of hygrometer, treatment of mean flow, and so on. It also needs relatively large financial and human costs for keep it. We could do only in the intensive observation periods in HEIFE, and could do about four months almost continuously in GAME-Tibet. Now we are standing just before continuous turbulence measurement in the field.
The relationship between mean profiles and turbulent transport over arid and semi-arid area is one of the targets of study, because it is an inavoidable part of numerical modelings. The flux-profile relationship was studied in the long time from Monin and Obukhov or Prandtl but it still under discussion especially in this kind of extreme condition in nature, as mentioned below.
In the HEIFE project, the tower profile observations all through the year were made, as well as the turbulence measurement in intensive observation periods. Tsukamoto et. al. (1995)[5] shows the results of the oasis observation and Mitsuta et. al. (1995)[10] shows that of the desert observation.
Over the irrigated farm land in Zhangye oasis, the sensible heat flux are small, and sometimes downward even during daytime, The evapotranspiration, or latent heat flux, are very large in daytime beyond radiative input to the ground surface. This feature is called as oasis effect. The wet ground surface under dry atmosphere causes strong evapotranspiration, and it makes the surface temperature lower than air temperature. Reflecting the low surface temperature, the net radiation over oasis is larger than over desert. Also the residual of heat budget was observed. It is considered to show strong advection of heat and water vapor.
To understand these situation, we should better treat heat and water vapor transfer not in one dimensional problem. The dry air over moisten surface is kept by the advection from surrounding dry area. And the dry air promotes the evaporation/evapotranspiration. This is also called oasis effect.
Tsukamoto et. al. could use flux-profile relationship based on Monin-Obukhov similarity to estimated heat and vapor fluxes. Helped by strong evapotranspiration, the turbulent flux of water vapor can be estimated by the ordinary flux-profile relationship.
Over the desert, Tamagawa (1996)[13] failed to make flux-profile relationship for water vapor. They had actually no relationship. The accuracy of humidity measurement might be also problem. But the turbulent characteristics of specific humidity showed different features to that of temperature. The non-dimensionalized fluctuation of humidity is much larger than that of temperature. It can be understand as that the humidity fluctuation has weak relation to its vertical gradient.
Recently many papers pointed out this kind of difference. Asanuma and Brutseart (1999)[1] shows relatively large humidity fluctuation and Katul et. al. (1995)[6], Katul and Hsieh (1997)[7] and (1998)[8], and De Bruin et. al. (1999)[2] analyzed the dissimilarity between temperature and humidity. In those papers, the dissimilarity between temperature and humidity fluctuations caused relatively large humidity fluctuation, different eddy diffusivity, and so on.
It should be noted that the framework of Monin-Obukhov similarity
assumes steady monotone vertical profile and horizontal uniformity.
The fluctuations can be caused only by small eddies (![]() , roughly)
mixing air parcels in the profile. If really so, temperature and
humidity fluctuations must show perfect correlation.
But actually they sometimes show low or oposite correlation
in lower frequency range, even they correspond well
in high frequency range. Figure 5 shows
cospectral densities normalized by their power,
which are correlation coefficient
between temperature and specific humidity in each
frequency band. The data are measured at Amdo observation site
on Tibetan plateau in GAME
project[14]. The data at 21 June shows negative correlation
in lowest frequency range.
In that case, the active cloud convection
in the early monsoon season produced the opposit fluctuations.
The decrease in highest frequency region is due to measurement.
That kind of low frequency or large scale fluctuation is out
of the scope of Monin-Obukhov similarity,
but it might contribute to humidity and/or heat transport.
, roughly)
mixing air parcels in the profile. If really so, temperature and
humidity fluctuations must show perfect correlation.
But actually they sometimes show low or oposite correlation
in lower frequency range, even they correspond well
in high frequency range. Figure 5 shows
cospectral densities normalized by their power,
which are correlation coefficient
between temperature and specific humidity in each
frequency band. The data are measured at Amdo observation site
on Tibetan plateau in GAME
project[14]. The data at 21 June shows negative correlation
in lowest frequency range.
In that case, the active cloud convection
in the early monsoon season produced the opposit fluctuations.
The decrease in highest frequency region is due to measurement.
That kind of low frequency or large scale fluctuation is out
of the scope of Monin-Obukhov similarity,
but it might contribute to humidity and/or heat transport.

|
In arid area, the vertical gradient of humidity is expected to be small. Therefore the relative importance of lower frequency fluctuation may be larger, because high frequency fluctuation can be made by ordinal eddy's action to the profile. And also, the small vertical gradient of humidity has a week effect to prevail horizontal inhomogeneity of humidity. It may also contribute to make the low frequency fluctuation important. To consider the roll of the low frequency fluctuation for turbulent transport process makes us to brush up Monin-Obukhov similarity under non-steady condition or in a continuous spectrum. That may be good issue to study.
In any way, Mitsuta et. al. analyzed heat and water budget using the flux-profile relationship for the sensible heat not only with Monin-Obukhov similarity but also with free convective parameterization, and using the heat balance relationship to obtain the latent heat flux.
The heat balance equation at ground surface is
To investigate further, the data measured under different condition are required. The measurement in arid and semi-arid area can be good data in extreme condition without the surface canopy which makes measurements difficult.
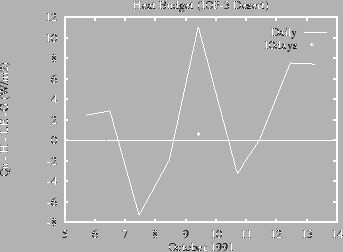
In the HEIFE case, the residual of heat budget equation
is showed in figure 6. Same but in other period
were shown in Mitsuta et. al..
Original data are taken every 30 minutes and the residuals
were sometimes over 100 W/m![]() , the daily averaged values and whole
averaged value are drawn in the figure.
The daily imbalance reaches more than 10W/m
, the daily averaged values and whole
averaged value are drawn in the figure.
The daily imbalance reaches more than 10W/m![]() and averaged are less than 1 W/m
and averaged are less than 1 W/m![]() .
The small imbalance after averaging suggests no systematic error.
The estimation for ground heat flux are thought to be bad for
each 30 minutes heat imbalance. The large surface temperature
variation and very large temperature gradient just under
the ground surface may be the problem, because the estimation
are sensitive to the interpolation method between surface radiative
temperature and the most upper ground temperature (5cm).
.
The small imbalance after averaging suggests no systematic error.
The estimation for ground heat flux are thought to be bad for
each 30 minutes heat imbalance. The large surface temperature
variation and very large temperature gradient just under
the ground surface may be the problem, because the estimation
are sensitive to the interpolation method between surface radiative
temperature and the most upper ground temperature (5cm).
|
The annual variation of evaporation at HEIFE desert station are estimated in Mitsuta et. al. and that at oasis station in Taukamoto et. al. are drawn in the same axis in figure 7 with their precipitation. The evapotranspiration at oasis station are estimated by profile method after comparing direct measured one during IOP, and the evaporation at desert station from the heat budget method.
 |
The large condensation in winter at desert station seems to be questionable. It might be affected the error of heat budget.
The most impressible point is the very large evapotranspiration at oasis station in summer. It reaches about four times larger than precipitation. The strong effect of irrigation is appeared here. The evaporation at desert station are almost same amount to its precipitation, but a little larger than it. The accumulated amount of evaporation is about 120mm and that of precipitation is about 100mm at desert station, and accumulated evapotranspiration at oasis is reported as 535mm.