Precipitation process is a start of the surface process of water cycle. Therefore the topic related precipitation is selected as a start of this paper.
Figure 1 shows a probability distribution of precipitation intensity at the desert station and the oasis station of HEIFE. The desert station is at 39.38N, 100.17E, 1391m ASL, and surface was covered by sand. The oasis station at 38.93N, 100.87E, 1483m ASL and it is in the biggest oasis which including Zhangye city. Those two stations were the basic stations of HEIFE.

|
The statistics of the precipitation are similar and the precipitation over oasis seems to be a little larger. The distance between the two site is about 60km. The statistical feature suggests that the precipitation is not caused by local process but by large scale disturbances.
Sahashi (1995)[12] analyzed the daily precipitation at Tikanrik, Hami, Jiuquang and Lanzhou in summer. According to him, the precipitation propagates from west to east at least 2000km in summer. Itano (1997)[3] and Itano (1998)[4] analyzed the precipitation and synoptic disturbances in the area.
|
|
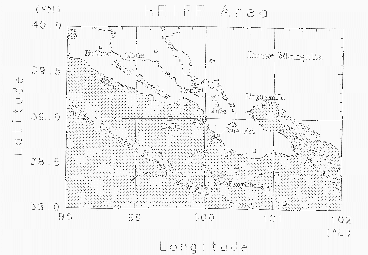
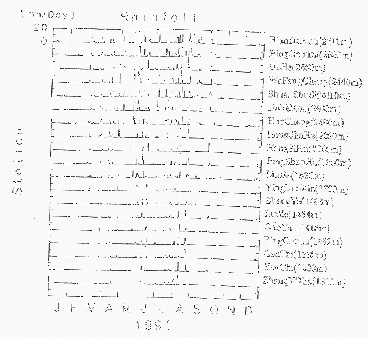
The daily precipitation data at the stations in the map of
figure 2 are shown
in figure 3, which are from his paper.
The precipitation events occur at the same time
of the upper troughs passing over the area,
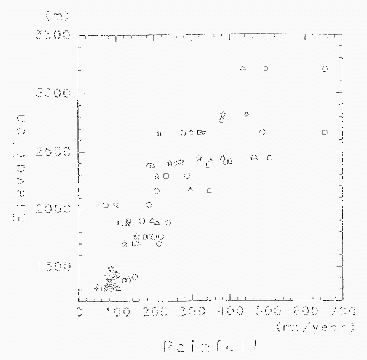
but the amount of the precipitation decreases as the altitude become
lower. The height dependency of precipitation amount is well known
phenomena. It is also clearly shown in figure 4 from his paper.
The regression line is about
| (1) |
He also suggested that the evaporation of precipitation in the boundary layer may affect the amount of precipitation. It can be understood with the facts that the virga can be easily observed and that precipitation occurred with high relative humidity at the cloud base, the latter of which was shown in his paper.
|
These research showed the precipitation events are the large scale phenomena but precipitation reaching to the ground surface is sometimes very local one, especially depend on its altitude. To investigate water cycle in arid and semi-arid region, the rain gauge network distributed in wide altitude range is needed rather than radar observation alone which measures the hydrometeor in the air. Or the radar observation with boundary layer sounding may be usable.